Abstract:
The optical properties of silicon-incorporated diamond-like carbon (Si-DLC) nanocomposite thin films have been reported. The Si-DLC nanocomposite thin film deposited on glass and silicon substrate by radio frequency plasma enhanced chemical vapor deposition (RF-PECVD) process. Fourier transformed infrared spectroscopic analysis revealed the presence of different bonding within the deposited films and deconvolution of FTIR spectra gives the chemical composition i.e., sp3/sp2 ratio in the films. The optical band gap calculated from transmittance spectra increased from 0.98 to 2.21 eV with a variation of silicon concentration from 0 to 15.4 at. %. Due to a change in electronic structure by Si incorporation, the Si-DLC film showed broad photoluminescence (PL) peak centered at 467 nm, i.e., in the visible range, and its intensity was found to increase monotonically with at. % of Si.
INTRODUCTION:
Diamond-like carbon (DLC) has been extensively studied because of its unique properties such as high hardness, low friction coefficient, chemical inertness, and resistance against corrosion potential applications in science and technology. The DLC is a metastable form of an amorphous mixture of sp2 and sp3 hybridized carbon atoms, where the collective behavior of sp2 sites is responsible for the optical and electrical properties and the sp3 sites govern the mechanical properties. The sp2 and sp3 bonding ratio in the DLC matrix can be changed by the doping of different metals and non-metals such as Sn, Ag, Au, Pt, Cu, Mo, Ti, W, etc. In the DLC field, silicon-incorporated diamond-like carbon (Si-DLC) thin films are very important because they can solve some major drawbacks of pure DLC such as reducing residual internal stress, improved hemocompatibility properties, reduced hydrogen loss, graphitization, and improved high-temperature stability. In this present work, we reported the optical properties of silicon-incorporated diamond-like carbon (Si-DLC) nanocomposite thin films prepared by the RF-PECVD technique. Fourier transformed infrared spectroscopic analysis revealed the presence of Si-C, Si-H, and Si-H2 bonding within the deposited films, and deconvolution of FTIR spectra gives the chemical composition i.e., sp3 /sp2 ratio in the films. The transparency and the optical band gap increased with the increase in the Si atomic percentage in the films. The intensity of the photoluminescence peak in the visible range was increased with the increase of Si atomic percentage in the films.
EXPERIMENTAL DETAILS:
Synthesis of Si-DLC thin films
The radio frequency (13.56 MHz) plasma enhanced chemical vapor deposition (RF-PECVD) technique was used for the Si-DLC thin film deposition on glass and a silicon substrate. Silicon substrates were cleaned with 10 % HF solution in a proper way to remove the surface oxide layer. The substrates were ultrasonically cleaned for 20 min, acetone, and methanol in sequence. To carry out the deposition, the chamber was evacuated to a base pressure of 2×10⁻⁶ mbar and then acetylene (C2H2) gas was introduced into the chamber for a fixed deposition pressure of 0.5 mbar. The deposition time was varied from 12 to 15 min with RF power 180 Watt for Si-DLC thin film with thickness ~ 400 nm. Tetraethyl orthosilicate (TEOS) dissolved in methanol was used for silicon incorporation in the DLC matrix. Argon (Ar) gas was passed through the TEOS solution to form the bubble and then introduced into the deposition chamber. The at. % of Si in the deposited Si-DLC thin films varied from 0 to 15.4 by changing the TEOS percentage in the solution.
Characterizations
The composition of the films (Si, C) was determined by energy dispersive X-ray analysis (EDX, Oxford, model-7582). Bonding information and the composition i.e., the sp2 /sp3 ratio in the synthesized thin films were analyzed by a Fourier transform infrared spectrophotometer (FTIR, Shimadzu - 8400-S). The FTIR absorbance spectra were recorded by taking Si as the reference and subtracting the absorption due to the Si substrate. The optical transmittance measurements were done using a Perkin Elmer UV-Vis spectrometer (USA). Photoluminescence spectra have been recorded by a fluorimeter (FL 4500, Hitachi) at room temperature. The excitation wavelength was 300 nm (Xenon lamp, 100 W).
RESULTS AND DISCUSSION
Chemical composition analysis Compositions of the Si-DLC films (Si, C) were determined by energy dispersive X-ray (EDX) analysis. The FTIR spectra show the different vibrational modes of various bonding for Si-DLC films in figure 1(a). In the case of Si-DLC film, the peak in the range 1400 to 1600 cm-1 is assigned to vibrations due to the C = C (sp2 ) stretching mode, and the broad peak around 2950 cm-1 is assigned to the different C-Hn group stretching modes. In the FTIR spectra, the CH3 asymmetric stretching vibration was observed at around 2975 cm-1, whereas the absorption occurs at about 2930 cm-1. The CH3 symmetric vibration occurs at about 2865-2885 cm-1 and the CH2 absorption occurs at 2850 cm-1. It is clear from figure 1(a) that the absorption peaks shifted up around the wave number of 2950 cm-1 with increasing Si content in DLC films. The strong FTIR absorption of the C-H stretch was obtained in the range 2800-3150 cm-1 which reveals a high H content in the films. The baseline correction is done for the selected region of CH stretching and deconvoluted peaks were curve fitted in a Gaussian distribution. The values of the sp3 /(sp2 +sp3 ) ratio have been calculated from the deconvoluted FTIR spectra, which shows that the overall sp3 fraction increased with the increase of at. % of Si in the DLC films as shown in figure 1(b). It is clear from the above discussion that the Si-DLC films become more diamond-like in nature with increasing at. % of Si.

Optical band gap characterization
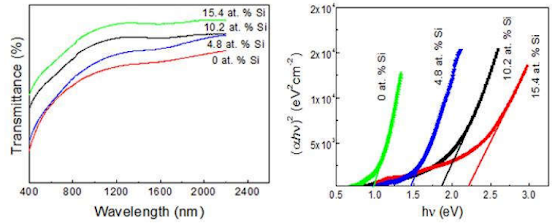
Figure 2(a) shows the gradual increase of the optical transmittance for Si-DLC films in the visible and near-infrared region with an increase of at. % of Si in the DLC films. The transmittance spectra revealed that the Si-DLC films have high transmittance in the visible wavelength region and sharp absorption edge in the ultraviolet region and suffer significant blue shift with the increase of the Si content. The optical band gap energy Eg of the Si-DLC calculated from the transmittance data and using Tauc expression as given below
 Eq (1)